Beyond Step Counts: Why Comprehensive Monitoring Changes Everything
A client comes to you exhausted. They're eating well, exercising regularly, and getting eight hours in bed each night. But they feel terrible.
You look at their basic fitness tracker: 10,000 steps daily, decent calorie burn, "good" sleep score.
Everything looks fine. So why do they feel awful?
This is the problem with tracking only a few surface-level metrics. You're seeing the symptoms, not the story.
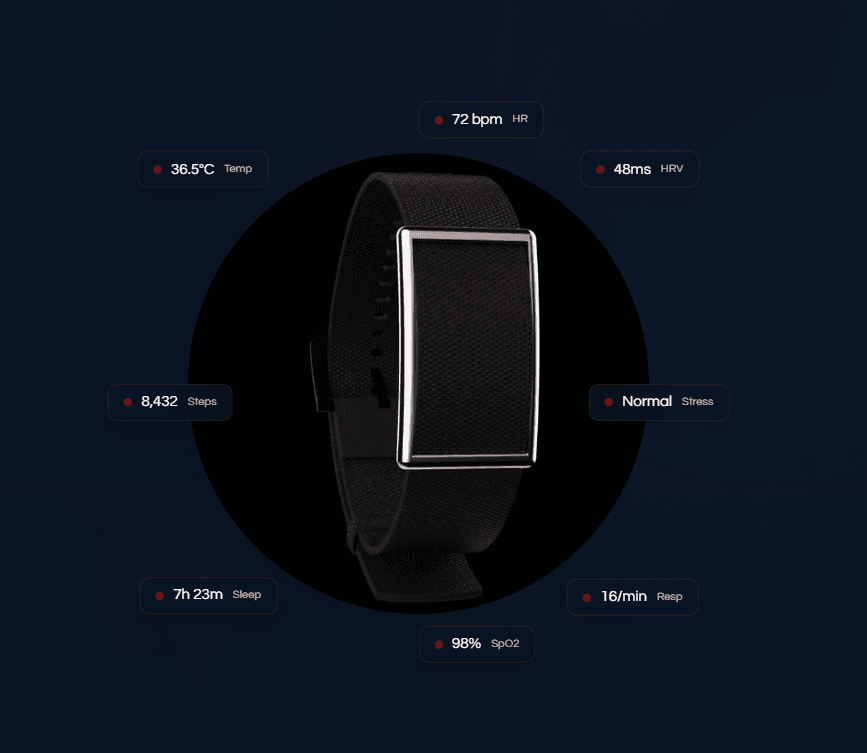
CardioMood gives you the complete picture. Not just whether your client moved today, but whether their body is recovering, adapting, and thriving.
Let's break down every metric in the CardioMood platform and, more importantly, how to actually use them to transform your coaching.
Heart Rate: The Foundation Metric
Heart Rate (Intraday Readings)
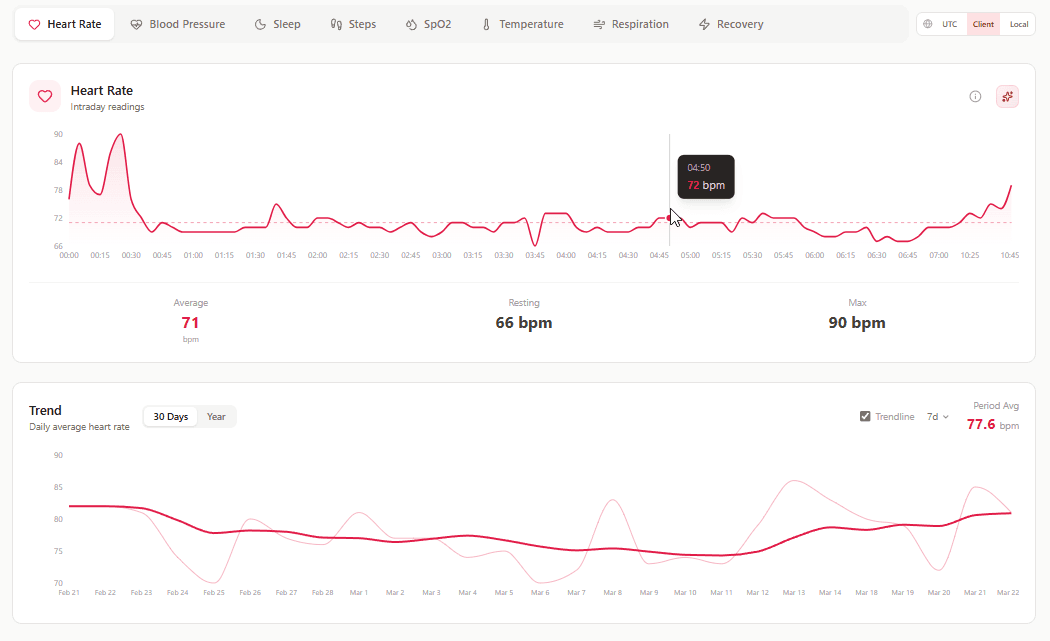 What it shows: Beat-by-beat heart rate throughout the day.
Why it matters: Shows real-time cardiovascular response to activity, stress, and recovery. You can see exactly when heart rate spikes (stressful meeting? intense workout?) and how quickly it recovers.
How to use it: Look for patterns. Does heart rate stay elevated after workouts? Recovery might be compromised. Does it spike during certain times of day? Identify stressors. Is resting heart rate creeping up over days? Early warning sign.
Coaching insight: Use intraday readings to validate or challenge client perceptions. "You said that meeting wasn't stressful, but your heart rate jumped 30 bpm and stayed elevated for an hour."
Trend (Daily Average Heart Rate)
What it shows: Average heart rate across each day, displayed as a trend line.
Why it matters: Shows whether cardiovascular demand is increasing, stable, or decreasing over time. Rising average heart rate over several days often indicates accumulating stress or insufficient recovery.
How to use it: Track week-over-week trends. If average daily heart rate is climbing despite consistent activity, investigate why. Could be overtraining, illness, stress, or poor sleep.
Red flag: Daily average increasing 5+ bpm over 3-5 days without increased activity level.
Blood Pressure: Continuous Cardiovascular Health
Blood Pressure (2-Hour Interval Readings)
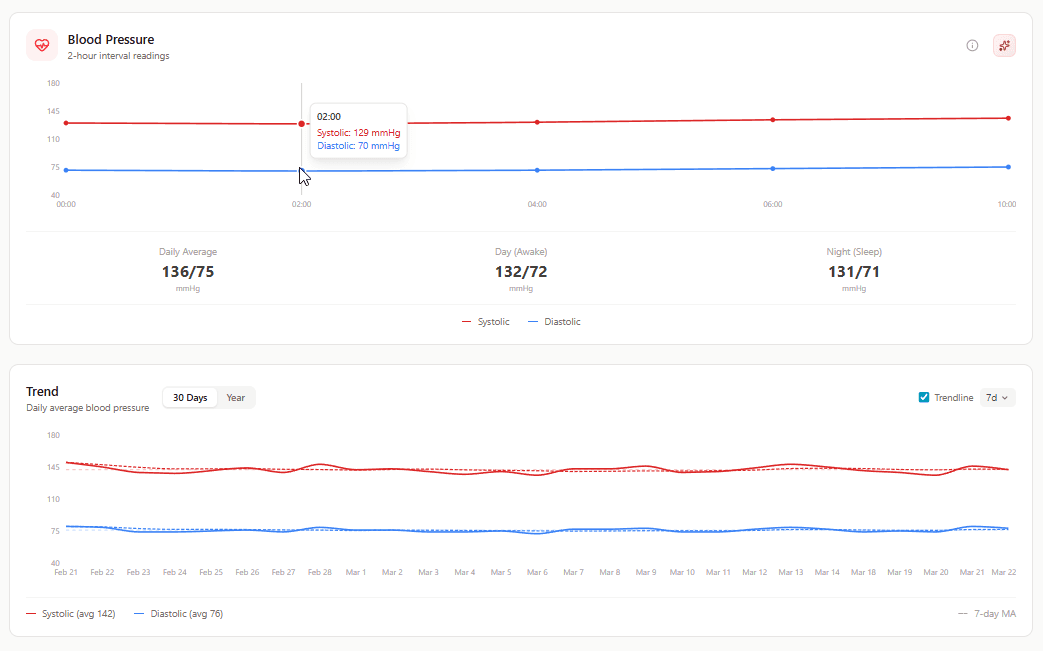 What it shows: Systolic and diastolic blood pressure measured every 2 hours throughout the day.
Why it matters: Unlike a single doctor's office reading, this shows how blood pressure fluctuates with daily activities, stress, and time of day. Catches patterns that one-time measurements miss.
How to use it: Look for patterns, not just absolute numbers. Does BP spike during work hours? That's chronic stress. Does it stay elevated into the evening? Poor stress recovery. Is it consistently high even during rest periods? Medical referral needed.
Normal ranges: Around 120/80 is target, but individual patterns matter more than single readings.
Trend (Daily Average Blood Pressure)
What it shows: Average blood pressure for each day over time.
Why it matters: Shows whether cardiovascular stress is accumulating or improving with your interventions.
When to refer: Consistent readings above 140/90, or trending upward over weeks despite lifestyle interventions.
Sleep: Beyond Hours in Bed
Sleep Stages (Last Night's Sleep Timeline)
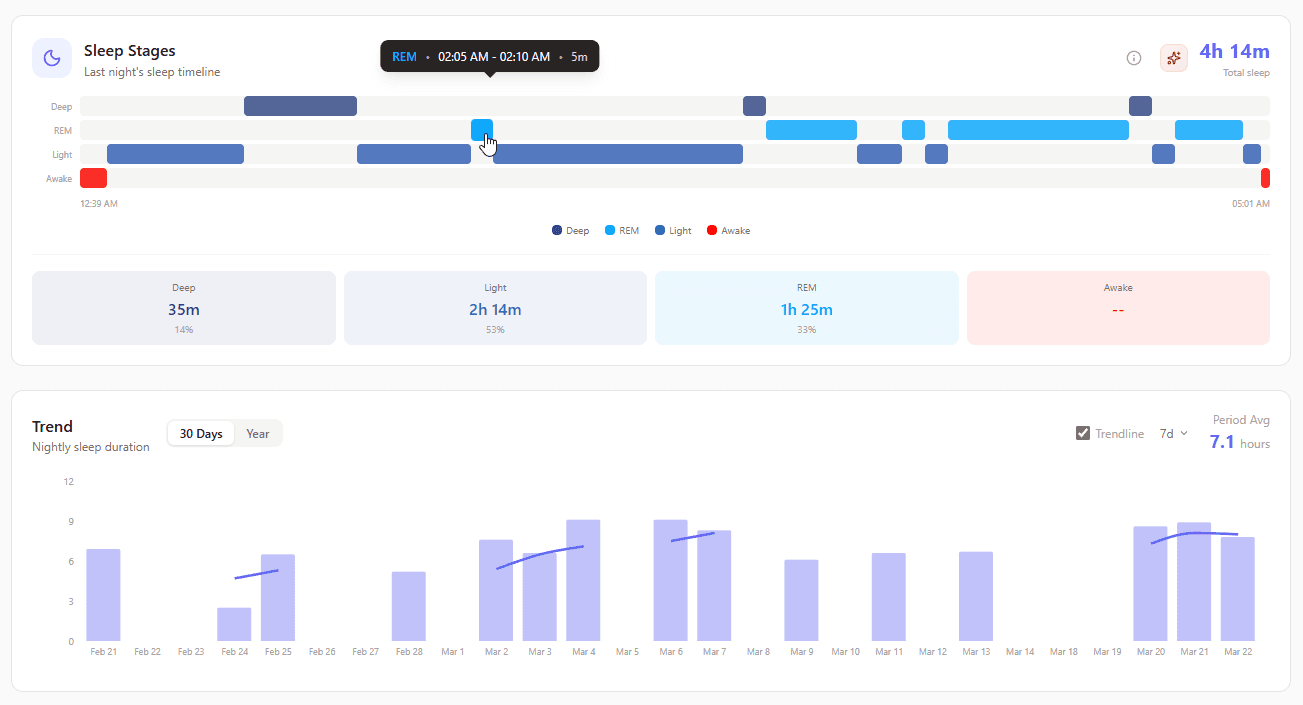 What it shows: Visual timeline of Light, Deep, REM, and Awake periods throughout the night.
Why it matters: "I got 8 hours of sleep" means nothing if it was fragmented or lacking deep/REM sleep. This shows sleep architecture quality, not just quantity.
What to look for:
- Deep sleep: 15-25% of total sleep. Critical for physical recovery and muscle repair.
- REM sleep: 20-25% of total sleep. Essential for mental recovery, memory, and mood regulation.
- Wake episodes: 1-2 brief wakes are normal. Frequent waking (4+) fragments sleep quality.
Coaching application: If a client reports sleeping enough but feeling exhausted, look at sleep architecture. Low deep sleep? They're not physically recovering. Fragmented REM? Mental performance suffers.
Practical fixes:
- Low deep sleep: Check training load (overtraining reduces it), room temperature (cool is better), evening stress levels
- Low REM: Look at alcohol consumption, late meals, sleep schedule consistency
- Frequent waking: Stress, overtraining, caffeine timing, room environment
Trend (Nightly Sleep Duration)
What it shows: Total sleep time each night over weeks/months.
Why it matters: Consistency matters as much as duration. Erratic sleep schedules disrupt circadian rhythm even if average duration is good.
How to use it: Look for patterns. Consistently short sleep on weekdays with catch-up sleep on weekends? That's sleep debt accumulation. Irregular duration? Circadian rhythm disruption affecting recovery.
Target: 7-9 hours consistently, with minimal night-to-night variation.
Activity Tracking: Movement Patterns
Steps (Intraday Steps)
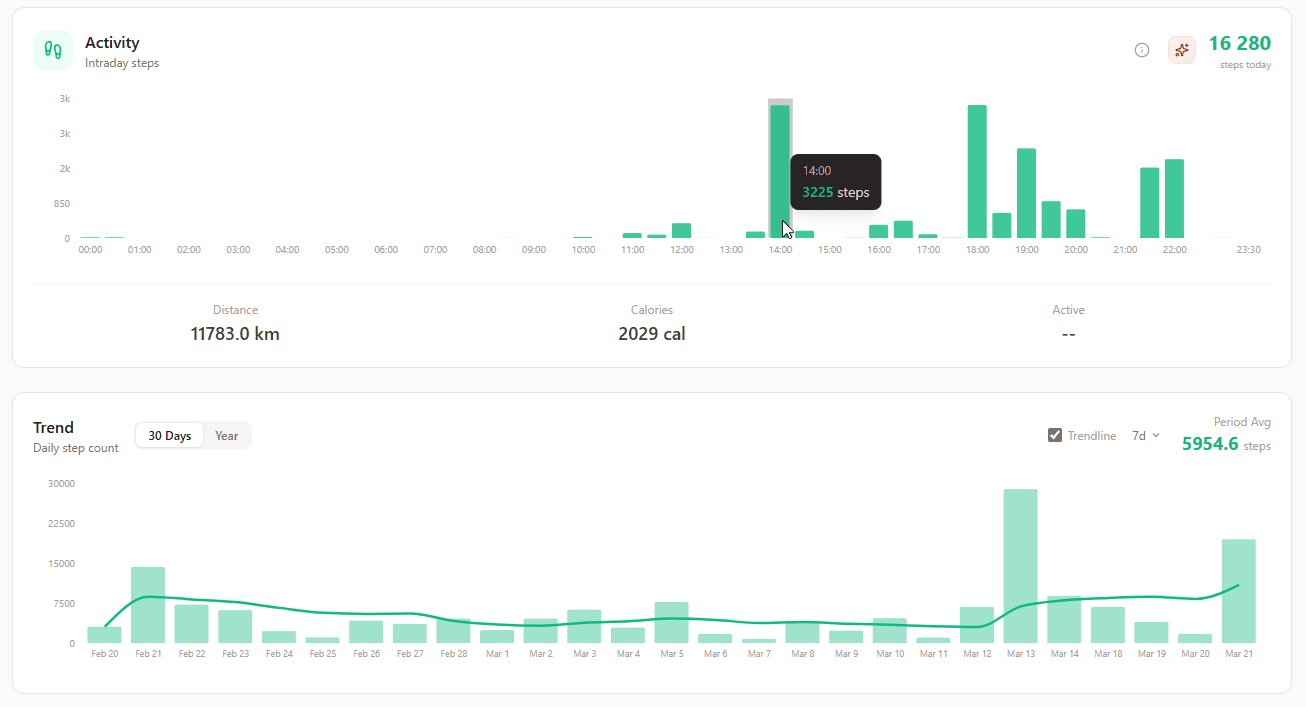 What it shows: Step count throughout the day with timestamps.
Why it matters: Shows movement distribution. Did they get 10,000 steps in one morning walk then sit all day? Or spread movement throughout the day?
How to use it: Long sedentary periods are a health risk even with high total steps. Use intraday data to encourage movement distribution, not just hitting a daily total.
Coaching tip: "Let's aim for at least 500 steps every 2 hours" often improves health more than "get 10,000 steps total."
Trend (Daily Step Count)
What it shows: Total daily steps over time.
Why it matters: Shows activity consistency and trends. Declining steps over weeks might indicate fatigue, burnout, or motivation issues.
How to use it: Good for sedentary clients to increase baseline movement. Less critical for already-active clients. Don't over-focus on this basic metric when you have more sophisticated data available.
Realistic targets: 7,000-10,000 for general health, but individualize based on client lifestyle and goals.
Respiratory Health: The Overlooked Vital Sign
Blood Oxygen (Intraday Readings)
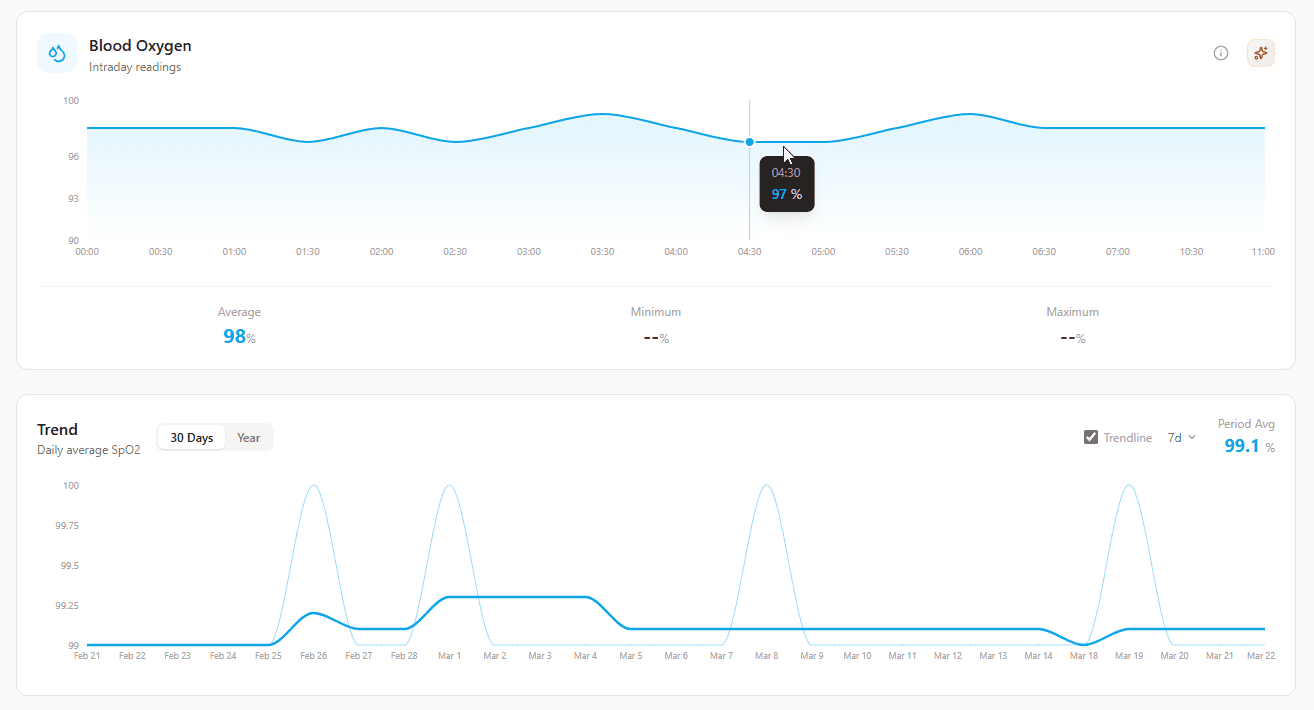 What it shows: SpO2 percentage throughout the day and night.
Why it matters: Normal is 95-100%. Below 94% warrants attention. Particularly valuable for monitoring recovery from respiratory illness, high-altitude adaptation, or identifying potential sleep apnea.
How to use it: Watch for drops during sleep. Frequent dips below 90% during sleep could indicate sleep apnea and warrant referral to a sleep specialist.
Post-illness monitoring: Essential for tracking recovery from COVID or respiratory infections. Should return to 95%+ consistently.
Trend (Daily Average SpO2)
What it shows: Average oxygen saturation by day.
Why it matters: Trending data shows whether respiratory function is stable, improving, or declining.
Red flag: Average consistently below 94%, or declining trend over days.
Respiration Rate (Intraday Readings)
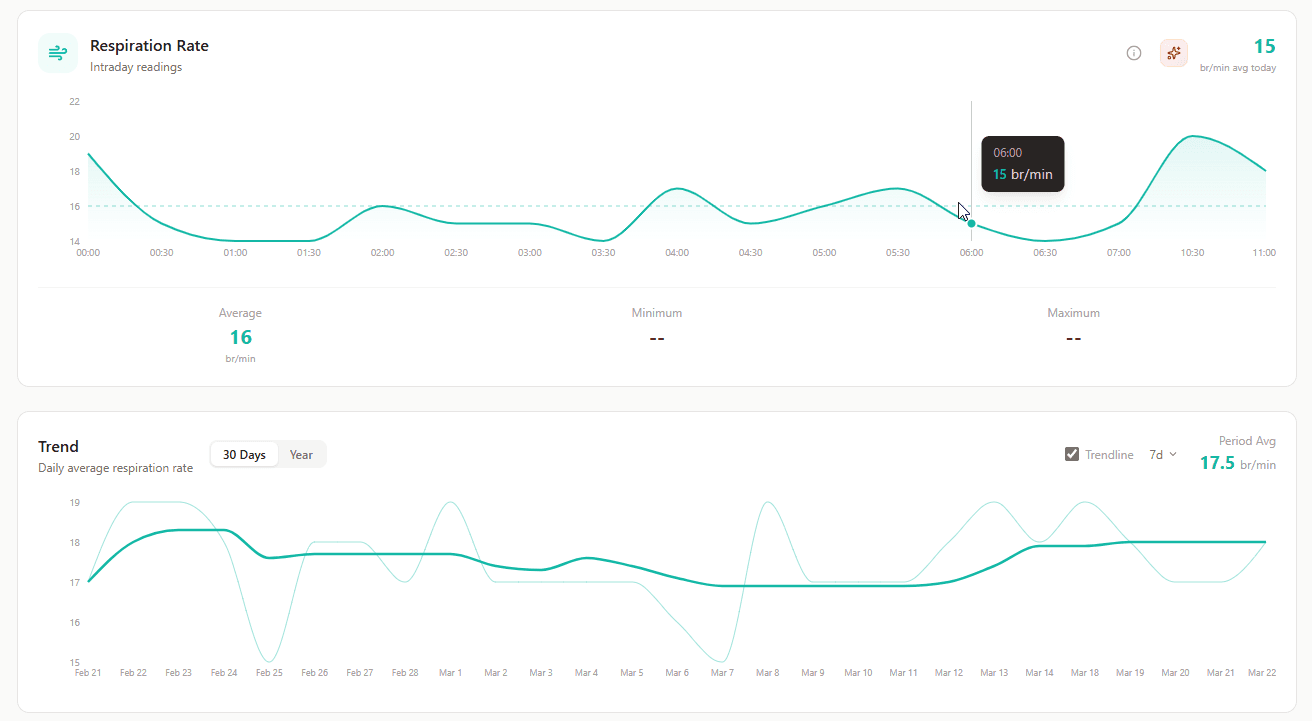 What it shows: Breaths per minute throughout the day.
Why it matters: Normal resting respiration is 12-20 breaths per minute. Elevated rates can indicate stress, illness, anxiety, or poor cardiovascular fitness.
How to use it: Compare daytime vs. nighttime rates. Nighttime should be lower (12-16). If it's consistently elevated even during sleep, investigate stress, overtraining, or health issues.
Pattern to watch: Respiration rate increasing over several days often precedes feeling sick.
Trend (Daily Average Respiration Rate)
What it shows: Average breaths per minute by day.
Why it matters: Tracks respiratory efficiency over time. Should decrease as cardiovascular fitness improves.
Coaching application: Use alongside heart rate and HRV data for complete cardiovascular health picture.
Temperature: Early Warning System
Temperature (Intraday Readings)
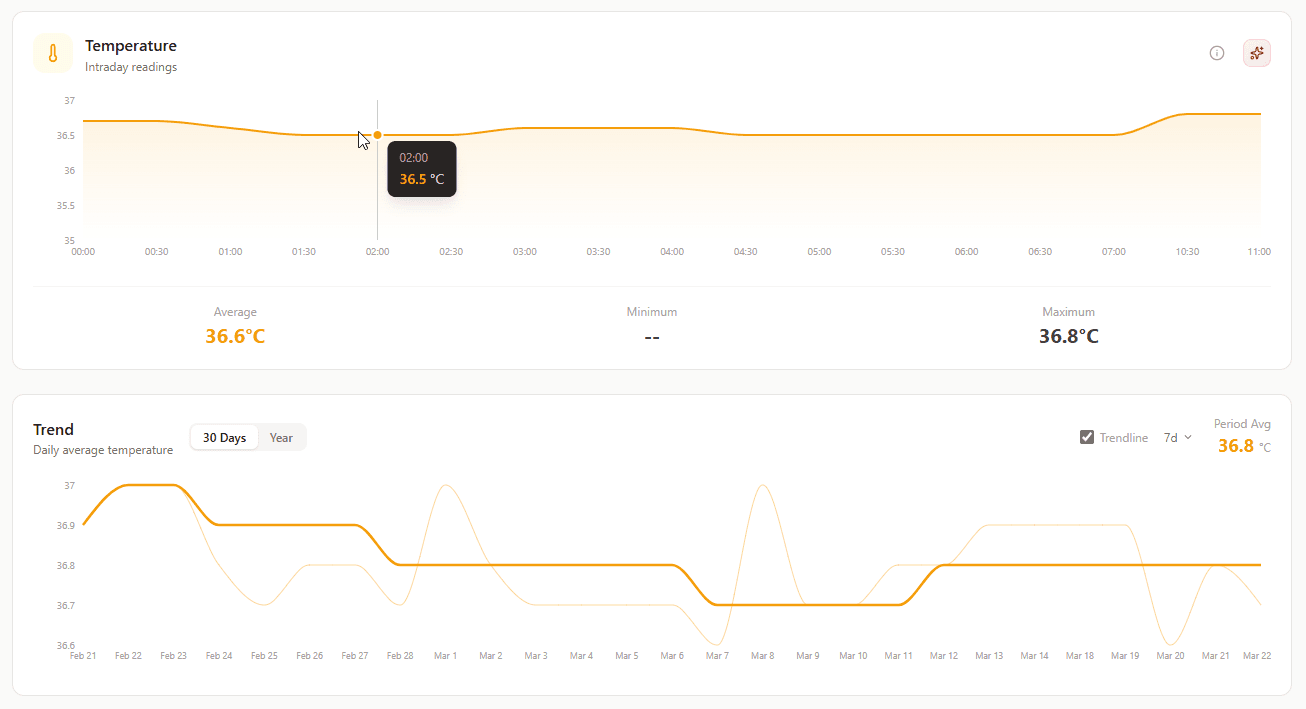 What it shows: Body temperature throughout the day.
Why it matters: Temperature spikes often precede feeling sick by 24-48 hours. Your client's body knows it's fighting something before symptoms appear.
How to use it: Establish individual baseline. A rise of even 0.5°C from baseline sustained over 24 hours is significant. Time to reduce training intensity and prioritize recovery.
For female clients: Core temperature rises during luteal phase of menstrual cycle. Can help identify cycle patterns.
Trend (Daily Average Temperature)
What it shows: Average daily body temperature over time.
Why it matters: Shows stability vs. disruption. Sudden sustained increases often indicate illness before client feels symptoms.
Practical use: "Your temperature has been elevated for two days. Let's cancel tomorrow's hard workout. Your body is fighting something."
Circadian Rhythm (7-Day Temperature Patterns by Time of Day)
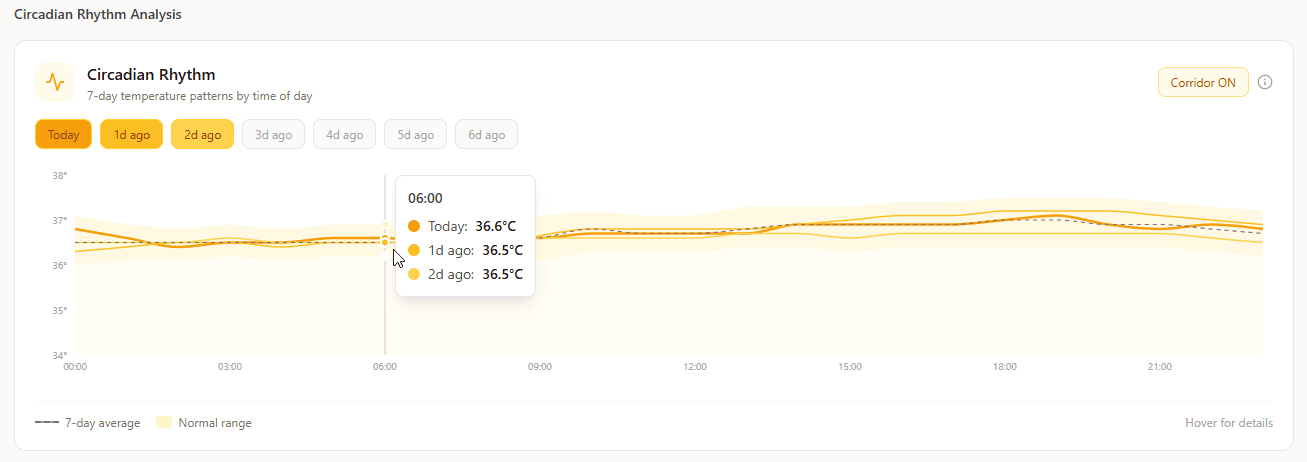 What it shows: Temperature patterns across different times of day, averaged over a week.
Why it matters: Body temperature naturally fluctuates in circadian rhythm. This visualization shows whether that rhythm is healthy and consistent, or disrupted.
Disrupted circadian rhythm indicators:
- Temperature not rising properly in morning
- Temperature not dropping properly at night
- Irregular patterns day-to-day
Coaching application: Circadian disruption affects sleep, recovery, and performance. Use this data to optimize sleep schedule, training timing, and light exposure recommendations.
Recovery Metrics: Know When to Push and When to Rest
Recovery Score (Readiness for Activity)
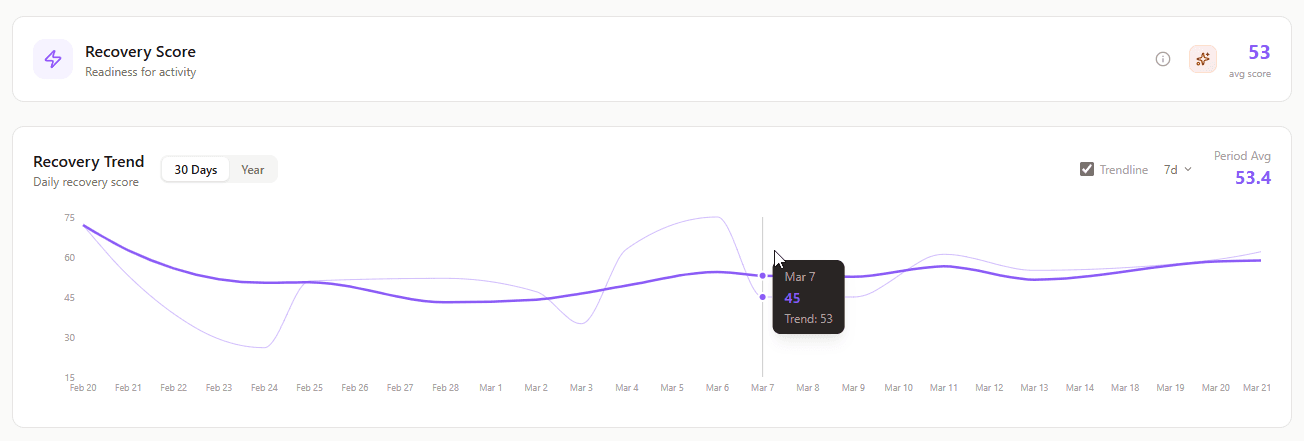 What it shows: 0-100 score indicating overall readiness for physical and mental demands, calculated from HRV, sleep quality, resting heart rate, and stress levels.
Why it matters: This synthesizes complex data into actionable guidance. It answers the most important daily question: "Should I push hard today or back off?"
How to use it: Make this part of your daily check-in routine.
The rules:
- 70-100%: Green light for intensity. Your client is recovered and ready.
- 50-70%: Moderate intensity okay. Skip the extremes. Good day for skill work or moderate training.
- Below 50%: Active recovery only. Light movement, stretching, walking. Investigate why it's low.
Coaching insight: Use this to override the calendar. If the program says "hard workout" but recovery score is 35%, you change the plan. The data tells you what the client's body can handle today.
Recovery Trend (Daily Recovery Score)
What it shows: Recovery score tracked over days, weeks, and months.
Why it matters: Shows whether your client is adapting to training or accumulating fatigue. Declining recovery trend despite rest days means something needs to change.
Pattern analysis:
- Steady or improving trend: Current approach is working
- Plateauing: Time to adjust stimulus or recovery strategies
- Declining trend: Red flag. Overtraining, under-recovery, or external stress accumulating
Autonomic Nervous System: The Master Controller
ANS Balance (RHR vs HRV Scatter Plot)
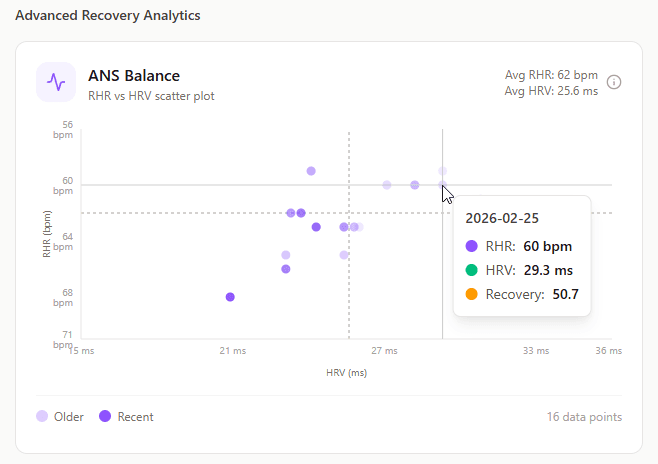 What it shows: Visual plot of resting heart rate vs. heart rate variability, showing autonomic nervous system balance.
Why it matters: This reveals the relationship between sympathetic (fight-or-flight) and parasympathetic (rest-and-digest) nervous system activity.
How to read it:
- Lower left (low HRV, high RHR): Sympathetic dominance. Stressed, overtrained, or fighting illness.
- Upper right (high HRV, low RHR): Parasympathetic dominance. Well-recovered, ready for challenges.
- Movement over time: Shows whether balance is improving or deteriorating.
Coaching application: Visual representation clients can understand. "See how you've moved from stressed (bottom left) to recovered (top right) over the past month? That's your nervous system adapting."
Night Recovery (HRV Trends Over Time)
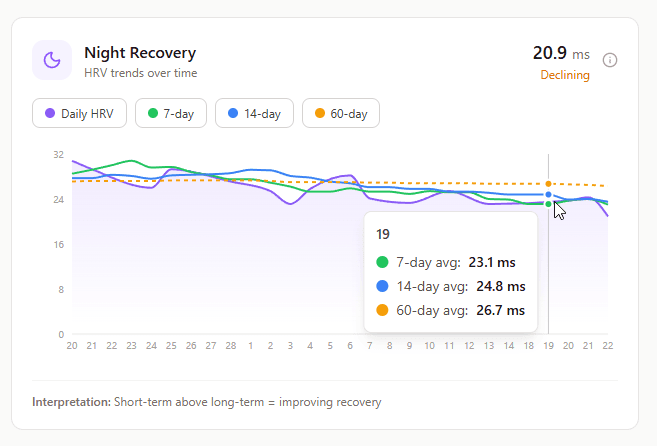 What it shows: Heart rate variability measured during sleep, tracked over time.
Why it matters: HRV is the gold standard for recovery assessment. Higher HRV generally means better recovery and stress resilience. Lower HRV suggests the body is under stress.
Critical point: HRV is highly individual. Don't compare clients to each other or population averages. Track each person's trend relative to their own baseline.
How to use it:
- HRV trending up: Adaptation happening, training is working
- HRV stable and high: Well-recovered, can handle intensity
- HRV dropping 20%+ from baseline for 3+ days: Major red flag. Overtraining, illness, or severe stress
Practical application: Use HRV to decide between pushing hard or backing off. High HRV = green light. Low HRV = focus on recovery.
What affects HRV:
- Sleep quality (biggest factor)
- Training load and recovery balance
- Psychological stress
- Illness (drops before symptoms appear)
- Alcohol (significant negative impact)
- Hydration status
Stress Metrics: Objective vs. Subjective Reality
Burnout Risk Score (Composite Stress Indicator 0-100)
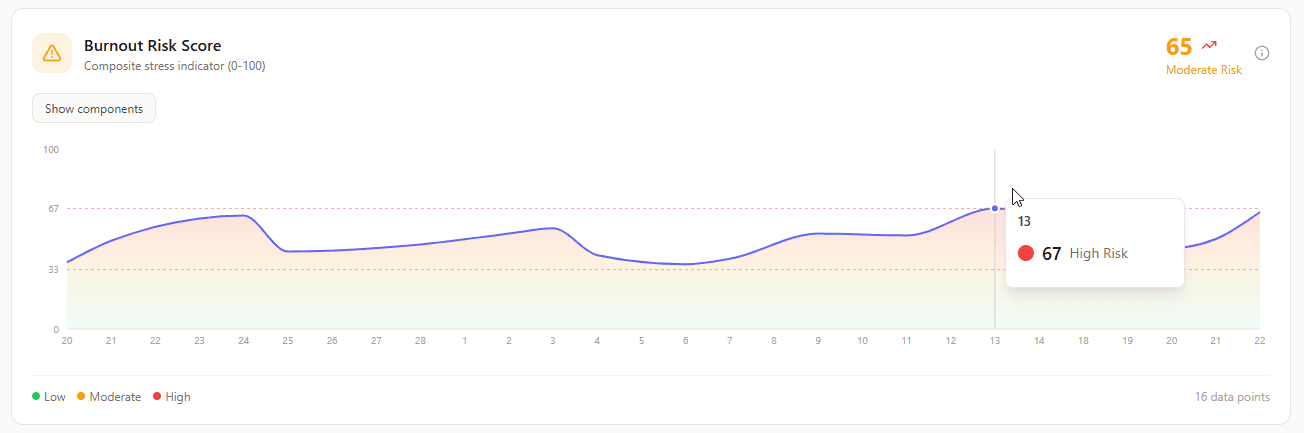 What it shows: Aggregated score from 0-100 indicating overall burnout risk based on sleep quality, stress levels, recovery patterns, and HRV trends.
Why it matters: Burnout doesn't happen overnight. It's cumulative. This score tracks the accumulation before it becomes a crisis.
Score interpretation:
- 0-30: Low risk. Client is managing stress well.
- 30-60: Moderate risk. Warning signs appearing. Time for intervention.
- 60-100: High risk. Burnout trajectory. Immediate changes needed.
Coaching application: Use this proactively. Don't wait for burnout to happen. When the score enters moderate territory, prioritize stress management over performance goals.
What to do at different levels:
- Low risk: Maintain current approach, monitor trends
- Moderate risk: Add stress management protocols, potentially reduce training volume, prioritize sleep
- High risk: Mandatory deload, possibly take full rest week, consider referral to mental health professional
Daily Stress Level (Normalized Stress Index 0-100)
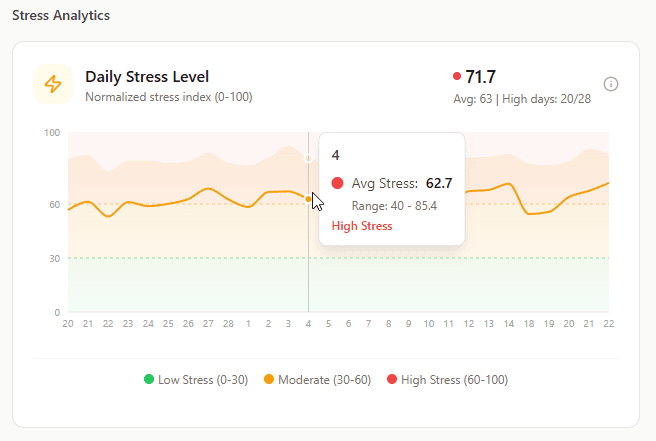 What it shows: Overall stress for each day, calculated from physiological markers (HRV, heart rate, respiration, etc.), not self-reported feelings.
Why it matters: Unlike self-reported stress ("I feel fine"), this shows what's actually happening in your client's nervous system. Someone can feel mentally okay while their body is maxed out.
How to use it: Look for patterns. Is stress high all day, every day? That's chronic stress heading toward burnout. Does it spike on certain days? Identify triggers. Is it high despite rest days? They're not actually recovering.
Coaching insight: Use stress data to validate or challenge client perceptions. "You say you feel fine, but your stress levels have been above 70 for five straight days. Your body is telling a different story."
Intraday Stress (Hourly Stress Patterns)
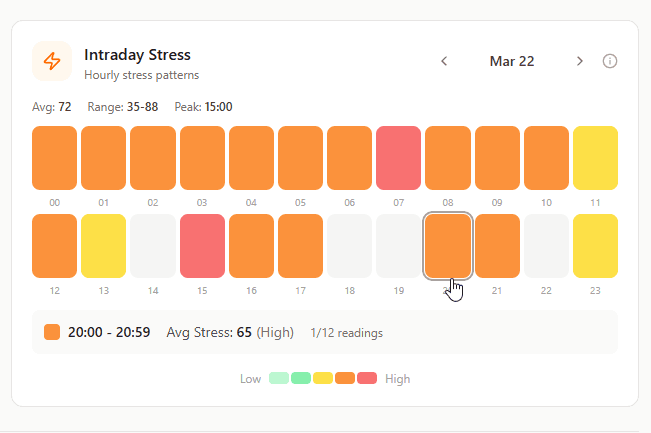
What it shows: Stress levels throughout the day, hour by hour.
Why it matters: Reveals when stress occurs and how long it persists. Is stress concentrated in work hours then drops? Or does it stay elevated into evening and night?
Pattern analysis:
- Stress during work, recovers in evening: Normal stress response, good resilience
- Stress stays elevated into evening/night: Poor stress recovery, will impact sleep and next-day performance
- Stress spikes at specific times: Identify triggers (meetings, commute, specific activities)
- Chronically elevated stress all day: Intervention urgently needed
Coaching application: "I see your stress spikes every day from 2-4 PM. What's happening during that window? Let's work on strategies specific to that trigger."
The Power of Combined Metrics: Reading the Complete Story
Individual metrics tell you something. Combined metrics tell you everything.
Pattern 1: The Overtraining Signature
What you see:
- Recovery score: 25-40% for 3+ days
- HRV: Down 25% from baseline
- Resting heart rate: Up 5-8 bpm
- Sleep stages: Reduced deep sleep
- Daily stress: Elevated despite rest days
What it means: Classic overtraining. Body is trying to recover but stimulus exceeds capacity.
What to do: Mandatory rest. Active recovery only (walking, light stretching). Don't resume intensity until HRV normalizes and recovery score is consistently above 60%.
Pattern 2: The Pre-Illness Warning
What you see:
- Temperature: Elevated 0.5-1°C above baseline for 24-48 hours
- Resting heart rate: Up 4-6 bpm
- Respiration rate: Slightly elevated
- HRV: Dropping
- Recovery score: Declining
What it means: Body is fighting something. Client might not feel sick yet, but they will.
What to do: Cancel hard workouts immediately. Prioritize sleep, hydration, stress reduction. Often you can prevent full-blown illness by catching this early.
Pattern 3: The Stress-Sleep Death Spiral
What you see:
- Daily stress level: 60-80 consistently
- Burnout risk: 50-70 and climbing
- Sleep stages: Fragmented, multiple wake episodes
- Sleep duration: Adequate but quality poor
- HRV: Low and declining
- Recovery score: 30-50 despite "getting enough sleep"
What it means: Chronic stress is destroying sleep quality, poor sleep is reducing stress resilience, creating downward spiral.
What to do: This isn't a training problem, it's a lifestyle crisis. Reduce or eliminate intense training temporarily. Focus entirely on stress management and sleep optimization. Consider recommending professional mental health support.
Pattern 4: Good Recovery, Ready to Push
What you see:
- Recovery score: 75-90%
- HRV: At or above personal baseline
- Sleep quality: Good deep sleep and REM percentages
- Resting heart rate: At baseline or below
- Stress levels: Moderate with good evening recovery
- ANS balance: Shifted toward parasympathetic
What it means: Client is well-recovered, adapted, and ready for challenges.
What to do: This is when you can safely push intensity. Progressive overload is appropriate. Take advantage of this window for adaptation.
Using Trends to Guide Long-Term Strategy
Daily data tells you what to do today. Trends tell you whether your overall approach is working.
Weekly Trend Review
What to check:
- Recovery score trend: Improving, stable, or declining?
- HRV trend: Adapting or accumulating fatigue?
- Sleep duration and quality: Consistent or erratic?
- Stress levels: Manageable or accumulating?
- Burnout risk: Stable or climbing?
Action based on trends:
- All trending positive: Current approach validated, continue
- Mixed signals: Identify the weak link, adjust that variable
- All trending negative: Major strategy change needed
Monthly Pattern Analysis
Look at the full picture over 4-6 weeks:
- Circadian rhythm stability: Is sleep-wake cycle consistent?
- Blood pressure patterns: Improving, stable, or worsening?
- ANS balance: Moving toward better recovery?
- Correlation between training load and recovery: Is dosage appropriate?
Big questions to answer:
- Is training load appropriate for recovery capacity?
- Are stress management strategies working?
- Is sleep quality supporting goals?
- Are we seeing adaptation or just accumulating fatigue?
Decision Framework: From Data to Action
Having all these metrics is useless if you don't know how to turn data into decisions.
Daily Decision Protocol
Check these three metrics every morning:
- Recovery score
- Sleep quality (stages visualization)
- Resting heart rate vs. baseline
Decision tree:
- All three look good? Proceed with planned training
- One concerning? Modify intensity or duration, proceed with caution
- Two concerning? Active recovery day, investigate cause
- All three concerning? Full rest day, deep dive into causes
When to Modify Training on the Fly
Mid-week check:
- Is recovery score declining day-over-day despite adequate sleep?
- Is HRV dropping consistently?
- Is resting heart rate climbing?
- Is stress elevated without obvious external cause?
Response: Don't wait for the weekend. Reduce intensity immediately. Add extra rest day mid-week.
When to Refer to Medical Professionals
Immediate referral needed for:
- Blood pressure consistently above 140/90
- SpO2 regularly dropping below 90%, especially during sleep
- Unexplained heart rate increases that don't resolve with rest
- Temperature elevations that persist beyond 3-4 days
- Any symptom (chest pain, shortness of breath, etc.) combined with concerning data
Your role: Monitor the data, recognize patterns, know when something is beyond your scope.
Making It Simple for Clients
Your clients don't need to understand every metric. That's your job.
What clients need to see:
- Recovery score: "Am I ready to train hard today?"
- Sleep timeline: "Did I sleep well?"
- Daily stress level: "How stressed was I?"
- Overall trends: "Am I improving?"
What you use behind the scenes:
- All metrics to get the complete picture
- Trends to validate strategy
- Patterns to catch problems early
- Combinations to understand root causes
Client communication: "Your recovery score is 38% this morning. I know the plan said intense intervals today, but your HRV is down and sleep quality was poor. Let's do active recovery instead. Your body needs rest to adapt."
They don't need to know what HRV is or how sleep architecture works. They just need to trust that you're making data-informed decisions in their best interest.
The Bottom Line
Comprehensive health monitoring isn't about drowning in data. It's about finally having the complete picture.
Each metric tells part of the story. Together, they reveal what's really happening in your client's body. Not what they think is happening. Not what they hope is happening. What's actually happening.
Heart rate shows cardiovascular response. HRV shows recovery capacity. Sleep stages show rest quality. Temperature predicts illness. Stress levels reveal nervous system state. Recovery score synthesizes it all into action.
That's the difference between good coaching and great coaching. Between satisfied clients and transformative results. Between guessing and knowing.
You wouldn't try to understand a book by reading random pages. Don't try to understand your client's health by tracking random metrics.
See the complete picture. Make better decisions. Get better results.
CardioMood monitors 19 clinically validated health parameters continuously, giving health coaches and wellness professionals the complete data they need to deliver exceptional outcomes. Medical-grade accuracy. Professional-grade insights. Learn more or request demo.